Excel Chart in VB.NET
We have the ability to generate dynamic and visually appealing charts in Excel by using the capabilities of VB.NET. In the following section, we will explore the process of creating a chart in Excel through VB.NET source code, enabling us to effectively represent data in a graphical format.
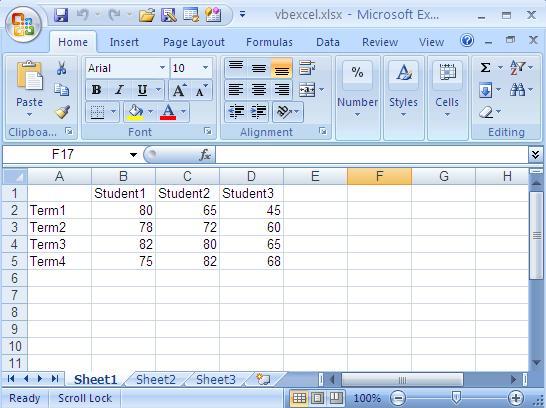
Before we proceed with creating a chart, it is essential to populate the Excel sheet with the relevant data. Once the data has been entered, the Excel sheet will begin to take shape, serving as the foundation for our chart creation. This step ensures that the data is organized and structured appropriately for chart generation.
To initiate the chart creation process in VB.NET, we must first create a chart object. This object acts as a container for our chart and allows us to configure various aspects such as its position, size, data range, and chart type. By customizing these parameters, we can tailor the chart to suit our specific requirements and visual preferences.
It is crucial to carefully select the appropriate chart type that best represents the underlying data effectively. Different chart types, such as bar charts, line charts, pie charts, and scatter plots, offer unique visual representations and insights. By understanding the nature of the data and the desired analytical goals, we can make an informed decision when choosing the chart type.
Once the chart object is created and configured, we can populate it with the necessary data range from the Excel sheet. This ensures that the chart accurately reflects the underlying data and provides a clear visual representation. By defining the data range, we establish the connection between the Excel sheet and the chart, allowing for real-time updates as the data changes.
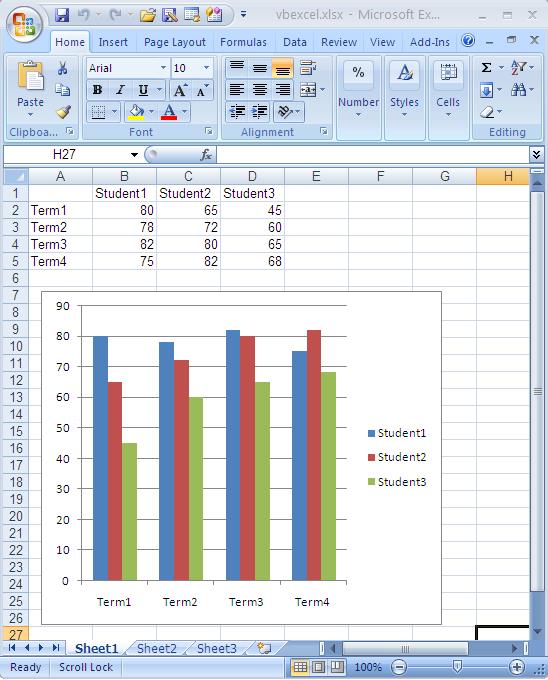
The following picture shows the excel file after created a chart.
Through the seamless integration of VB.NET and Excel, we gain the ability to create powerful and visually compelling charts that enhance data analysis and presentation. This combination of programming capabilities and Excel's charting functionalities empowers us to deliver insightful and impactful visualizations, facilitating effective communication and decision-making processes.
Full Source VB.NETConclusion
Following the outlined steps and utilizing the provided VB.NET source code, we can unlock the potential of Excel's charting capabilities and create professional-quality charts that add value to our data-driven endeavors.
- How to create an Excel file in VB.NET
- How to open or read an existing Excel file in VB.NET
- How to read an Excel file using VB.Net
- Add new worksheet in Excel file - VB.Net
- Delete worksheet from an excel file - VB.Net
- How to Format Excel Page in VB.NET
- How to insert a Picture in Excel through programing on VB.NET
- How to insert a background Picture in Excel through VB.NET
- How to export a Chart in Excel as Picture file from VB.NET
- How to Excel Chart in VB.NET Picture Box
- How to Excel DataBar in VB.NET
- How to Excel Data Validation Input Message
- Read and Import Excel File into DataSet or DataTable in vb.net
- How to insert cell data in an Excel file using OLEDB
- How to update cell data in an Excel file using OLEDB
- How to export from database to excel
- How to export from DataGridView to excel in VB.Net