Excel DataBar in VB.NET
The program presented below demonstrates how to perform commonly used formatting operations in an Excel spreadsheet. The main objective of this program is to format a page in Excel, particularly by entering data for a Mark List and applying various formatting techniques.
To begin, the program utilizes the MERGE function to merge cells and create a prominent heading for the Mark List. By combining multiple cells into a single cell, the heading becomes visually distinct and effectively conveys the purpose of the document. Additionally, specific formatting attributes such as bold font style are applied to highlight the students' names and total marks, further emphasizing their importance in the Mark List. Furthermore, a border is applied to the entire mark list section, enhancing its visual structure and making it more visually appealing and organized.
After you run the source code you will get an Excel file its look like in the following picture.
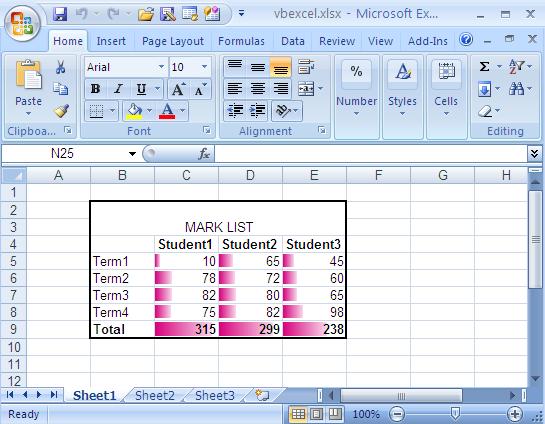
As a final touch, the program selects a designated range within the Excel spreadsheet and adds a DataBar formatting feature. The DataBar serves as a visual representation of the data within the selected range, allowing for easy identification and comparison of values. The choice of color for the DataBar can be customized based on preference and intended visual impact.
Upon executing the provided source code, an Excel file will be generated, closely resembling the appearance depicted in the accompanying picture. This output reflects the successful implementation of the formatting operations described above, resulting in a well-structured and visually appealing Mark List. The applied formatting techniques enhance the clarity and readability of the data, facilitating efficient analysis and interpretation.
Full Source VB.NETConclusion
By using the capabilities of the Excel object model and employing the appropriate formatting functions, we can achieve consistent and professional-looking Excel documents. The ability to seamlessly format data, merge cells, apply font styles, add borders, and utilize advanced features like DataBars empowers users to create visually compelling and meaningful representations of their data.
- How to create an Excel file in VB.NET
- How to open or read an existing Excel file in VB.NET
- How to read an Excel file using VB.Net
- Add new worksheet in Excel file - VB.Net
- Delete worksheet from an excel file - VB.Net
- How to Format Excel Page in VB.NET
- How to insert a Picture in Excel through programing on VB.NET
- How to insert a background Picture in Excel through VB.NET
- How to create a Chart in Excel in VB.NET
- How to export a Chart in Excel as Picture file from VB.NET
- How to Excel Chart in VB.NET Picture Box
- How to Excel Data Validation Input Message
- Read and Import Excel File into DataSet or DataTable in vb.net
- How to insert cell data in an Excel file using OLEDB
- How to update cell data in an Excel file using OLEDB
- How to export from database to excel
- How to export from DataGridView to excel in VB.Net